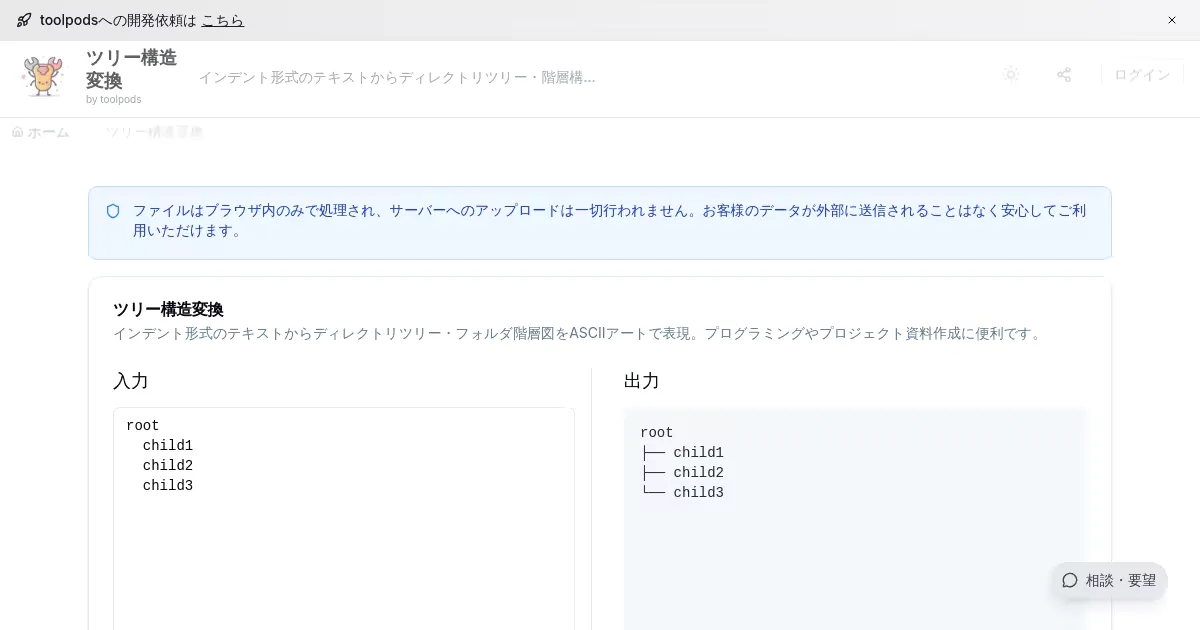
Tree Structure Converter (toolpods.io)
Visualize text-based tree structures as diagrams. Useful for representing folder structures or data hierarchies.

Simple Slide Creator (www.oh-benri-tools.com)
An online tool for creating simple slides in a browser. Supports adding, moving, and formatting text, as well as fullscreen display and downloading as an image. Input data is not sent to the server.
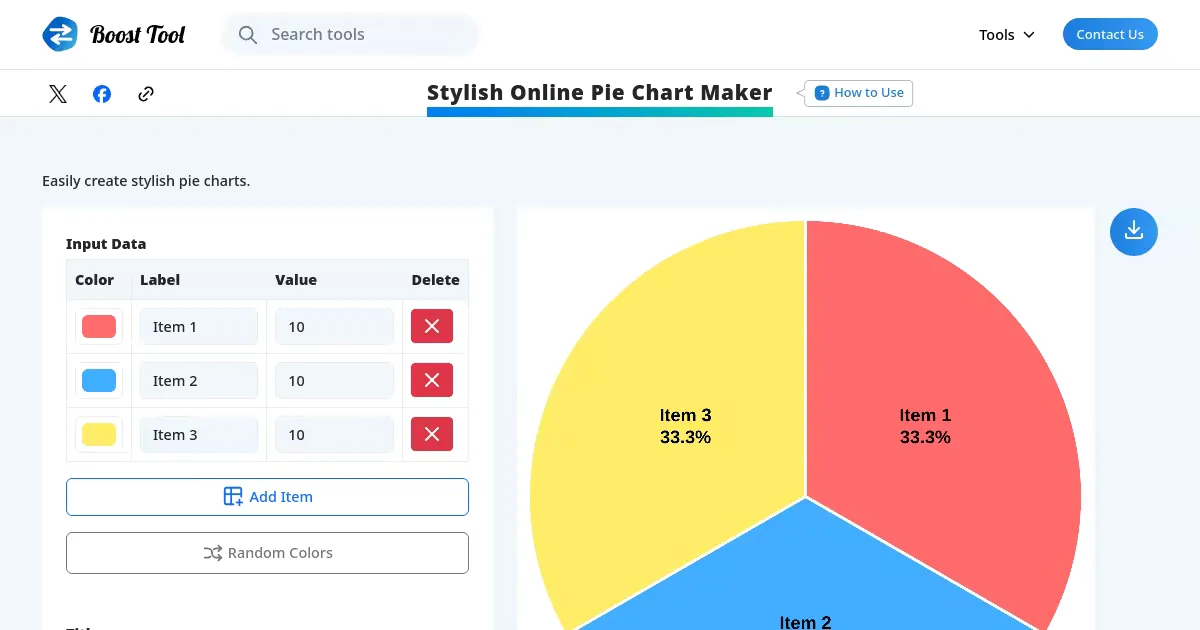
Pie Chart Maker (boost-tool.com)
A free online tool to create stylish pie charts from input data and download them as images. Useful for embedding in presentations or documents.
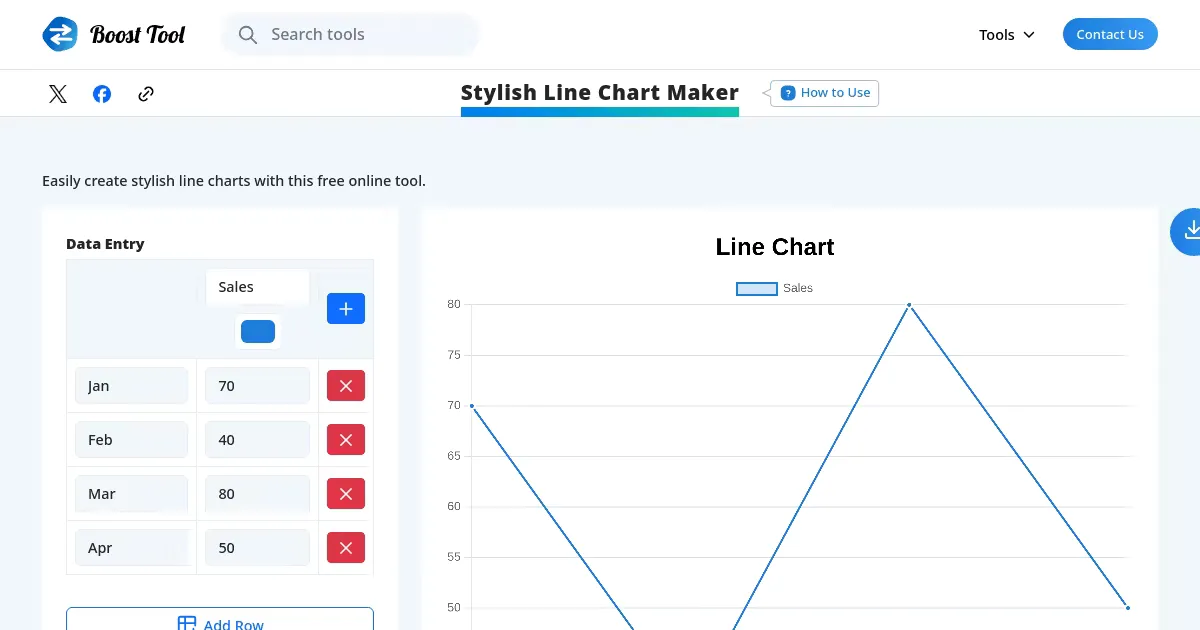
Line Chart Maker (boost-tool.com)
A free online tool to create stylish line charts from input data and download them as images. Useful for visualizing time-series data.
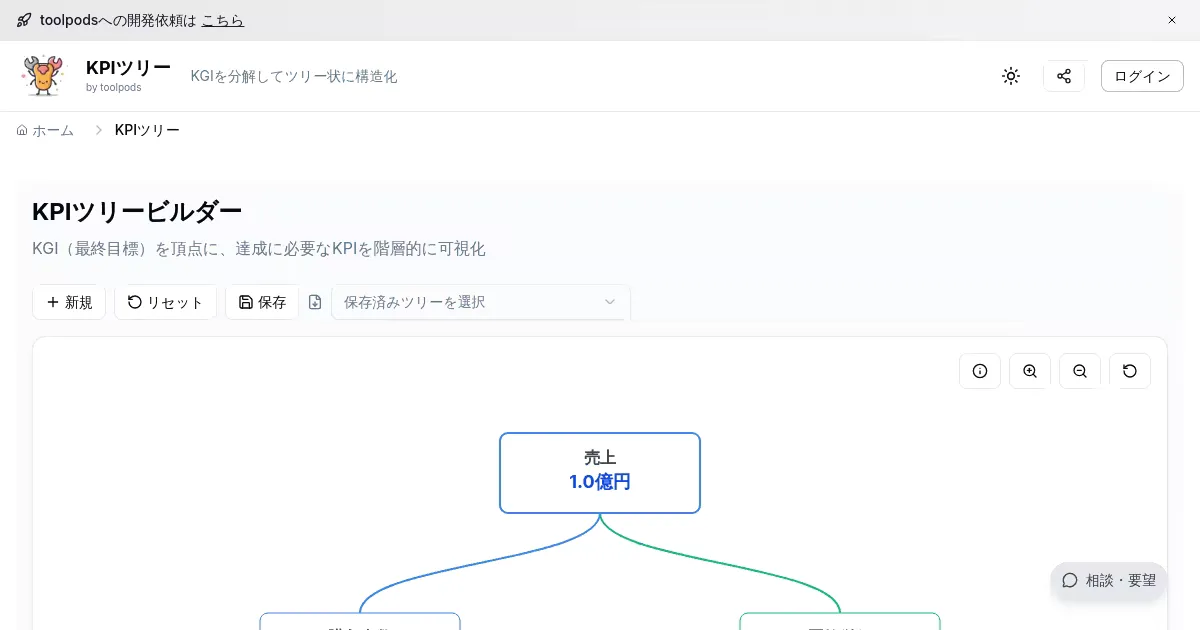
KPI Tree Builder (toolpods.io)
Visually build KPI trees. Decompose target metrics and organize their relationships in a hierarchical tree structure.
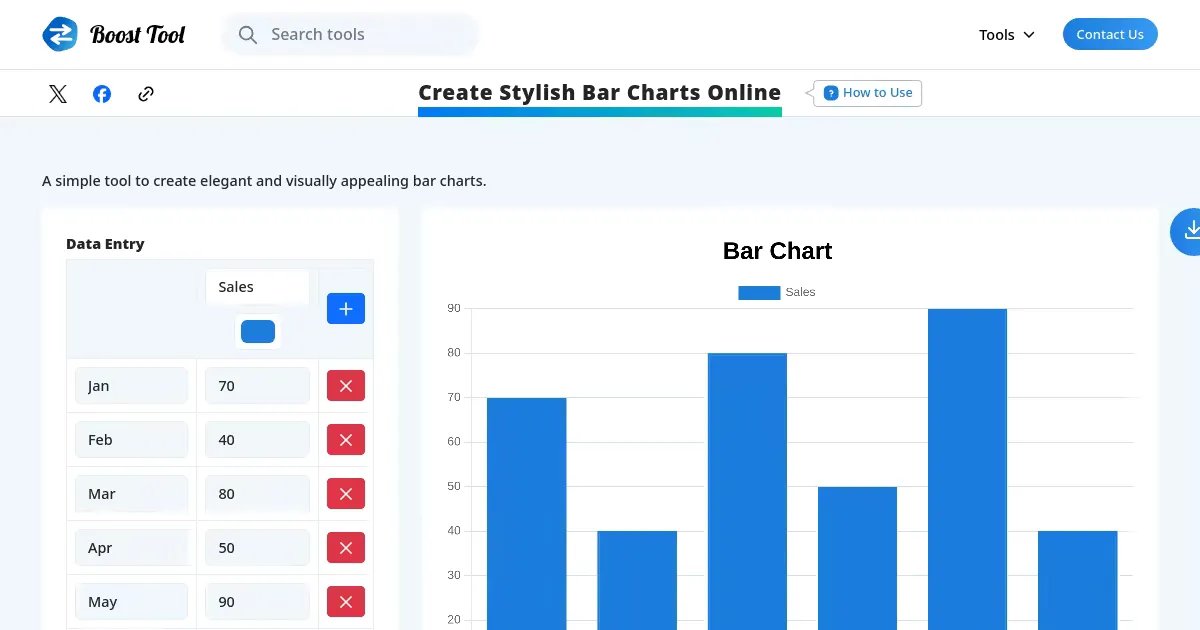
Bar Chart Maker (boost-tool.com)
A free online tool to create stylish bar charts from input data and download them as images. Useful for visualizing comparative data.