
Simple Slide Creator (www.oh-benri-tools.com)
An online tool for creating simple slides in a browser. Supports adding, moving, and formatting text, as well as fullscreen display and downloading as an image. Input data is not sent to the server.
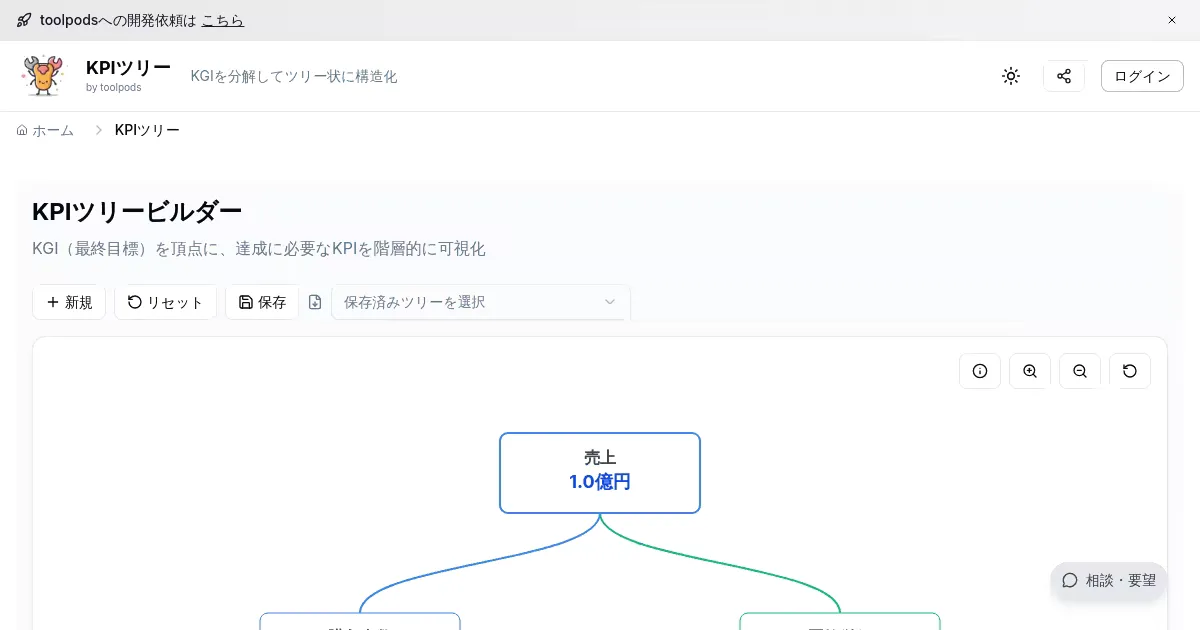
KPI Tree Builder (toolpods.io)
Visually build KPI trees. Decompose target metrics and organize their relationships in a hierarchical tree structure.
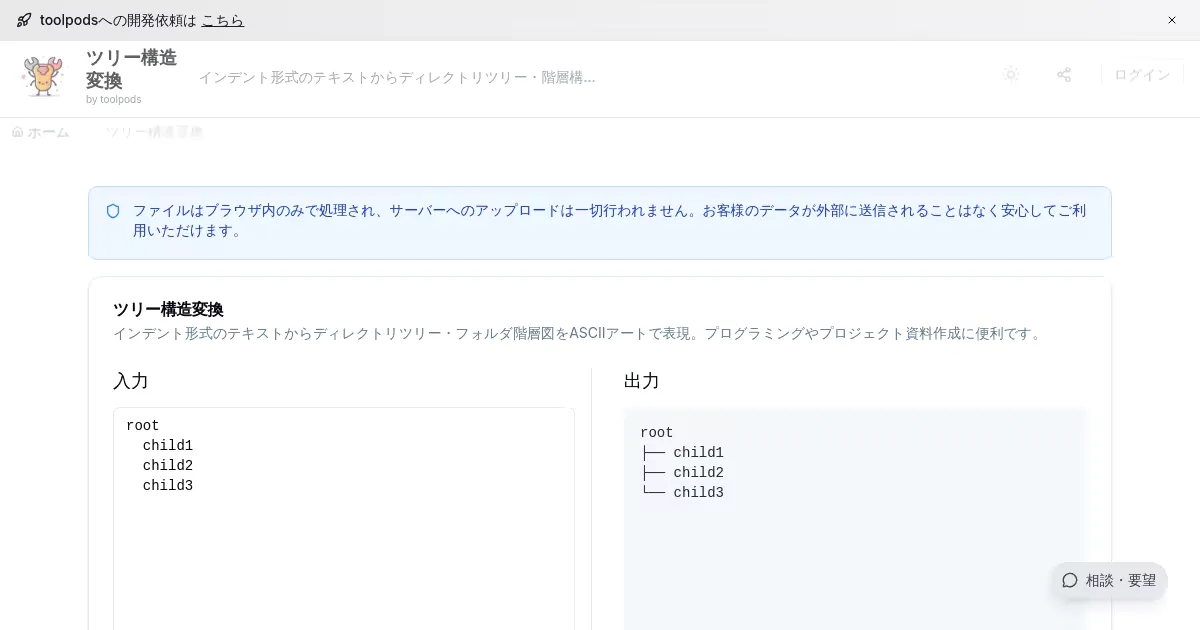
Tree Structure Converter (toolpods.io)
Visualize text-based tree structures as diagrams. Useful for representing folder structures or data hierarchies.
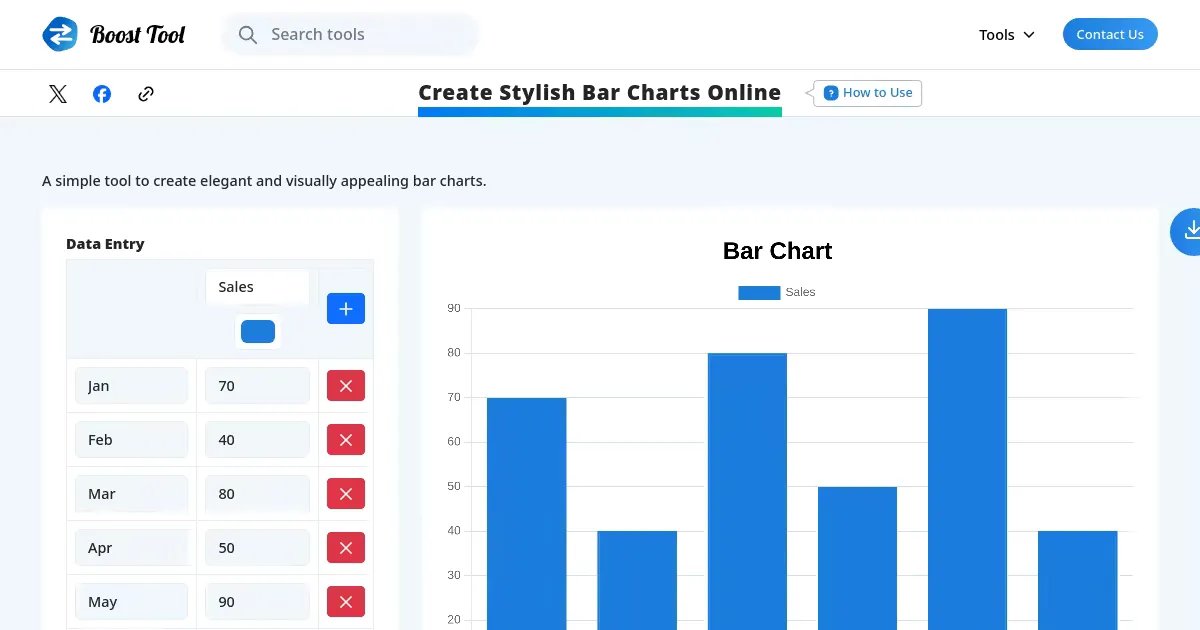
Bar Chart Maker (boost-tool.com)
A free online tool to create stylish bar charts from input data and download them as images. Useful for visualizing comparative data.
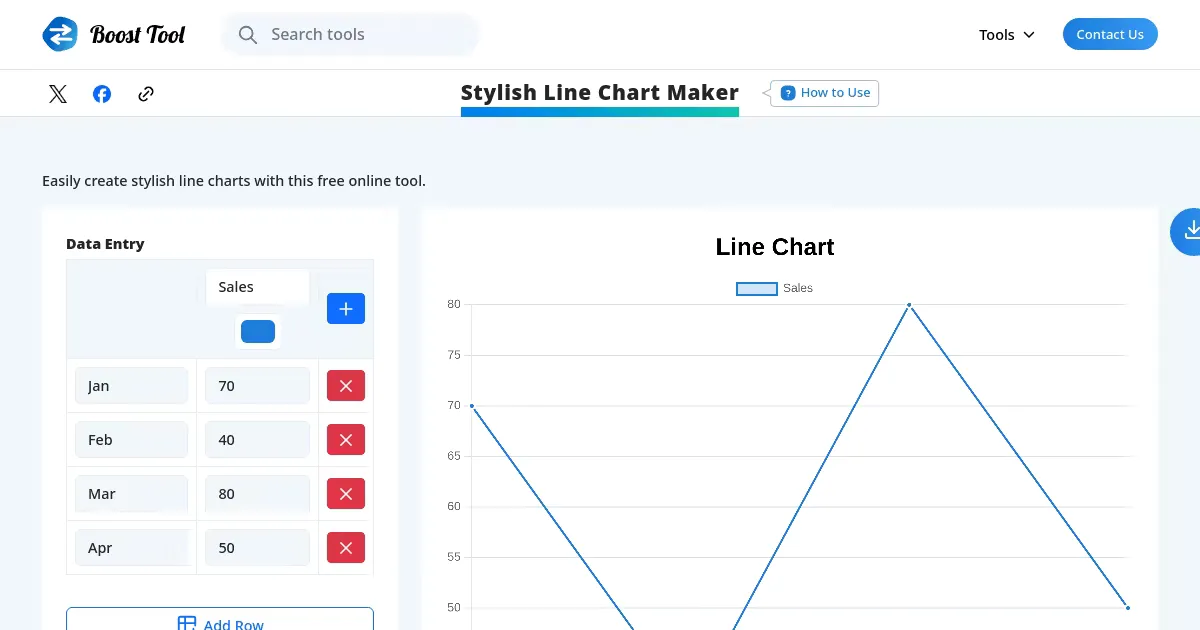
Line Chart Maker (boost-tool.com)
A free online tool to create stylish line charts from input data and download them as images. Useful for visualizing time-series data.
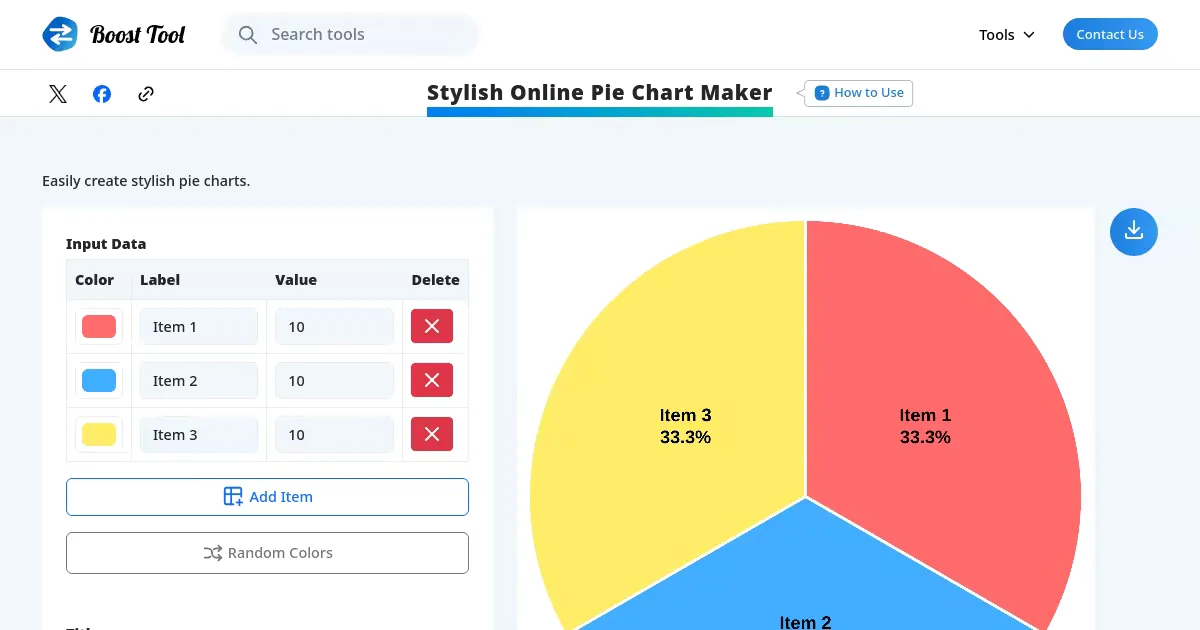
Pie Chart Maker (boost-tool.com)
A free online tool to create stylish pie charts from input data and download them as images. Useful for embedding in presentations or documents.